Dark Matter: Undergrad School Research
Projects | | Links: GitHub | Read More
An overview of the research I participated in during my undergraduate studies. IMAGE SOURCE
Introduction
My senior research was about me rebuilding the statistics of dark matter. I worked with Prof. Irit Maor for my senior research. Together we collected Type Ia supernova data to calculate the equation-of-state of the universe. As we typically hear, the majority of what comprises the universe is not what we actually see in the night sky. In fact, only about five percent of what we see account for the total energy of the universe. And this is what we set out to recalculate.
We expect the velocity of stars in a glaxy to decrease as a function of the distance from the center of the glaxy. What we find is the velocities seem to hold rather than decrease (see below). This 1922 discovery pushed the Dutch astronomer Jacobus Kapteyn to propose Dark Matter as a solution for the observed galactic rotation plot.
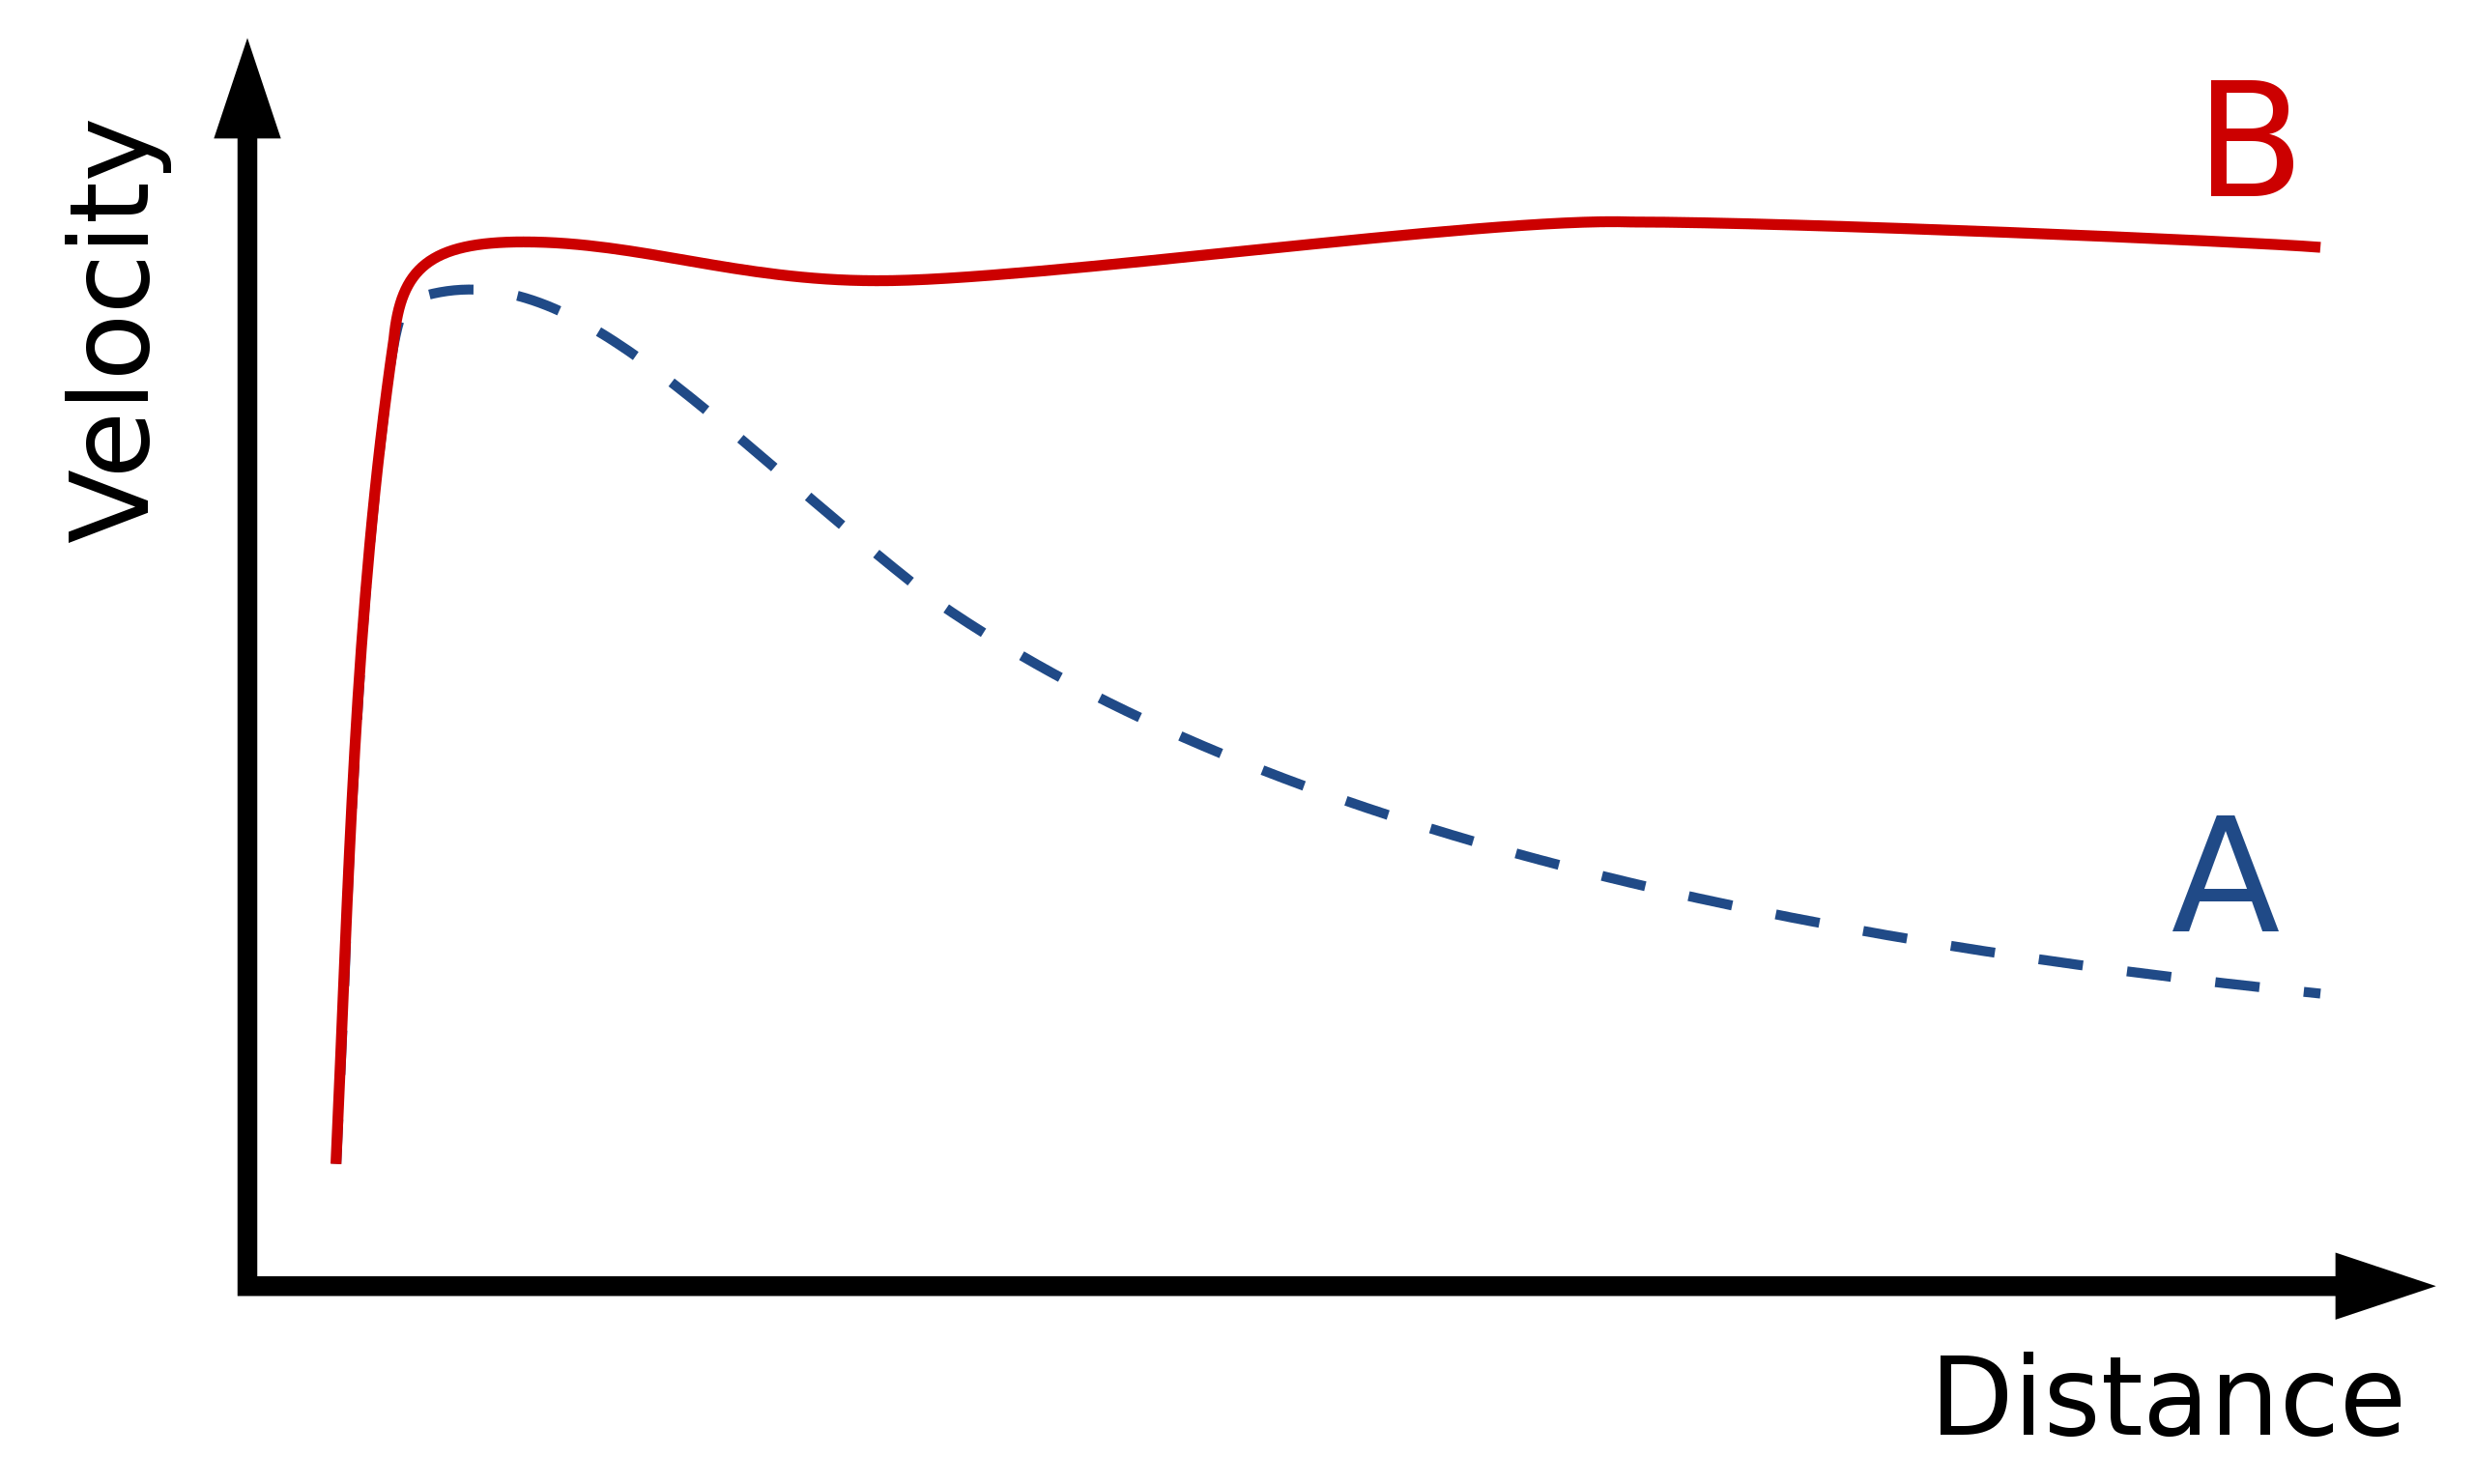 Rotation curve of a typical spiral galaxy: predicted (A) and observed (B). Dark matter can explain the ‘flat’ appearance of the velocity curve out to a large radius. IMAGE SOURCE
Extra mass would explain the difference between (A) and (B), but we should expect to see this mass. Perhaps the mass would be extra planets, asteroids, or meteors. Unfortunately we don’t see any extra mass. This means if there is extra mass it must be ‘dark’, meaning we can’t see it and it doesn’t interact with standard electrodynamics.
Type Ia supernova serve as a “standard candle” from which we can extract the equation of state of the universe. And we can use the equation of state to determine if the universe is flat. Knowing if the universe is flat helps us determine just how much mass we should expect to find and compare that with how much mass we actually see.
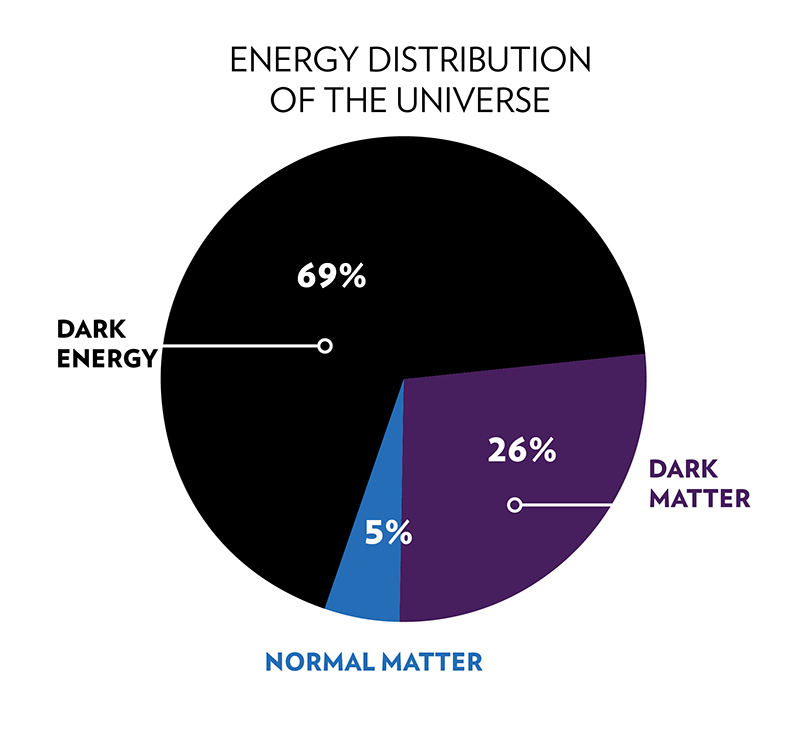
Scientists have determined that the univese is comprised of ~70% Dark Energy, ~25% Dark Matter, and 5% things we can see, such as planets, comets, and asteriods. IMAGE SOURCE
The universe is flat and it’s mostly comprised of things we can’t see or explain.
Statistical Analysis
We can perform our own analysis using supernova data. I used this paper, data table 11. The data is also available on GitHub.